
The basic formula for content marketing ROI is simple enough: take the revenue you earned, subtract what you spent, divide it by your spending, and multiply by 100. Easy, right?
The real trick, though, isn't the math. It’s figuring out what numbers to plug in. Accurately tracking the returns and the true costs is where most marketers get stuck, and it all starts with setting clear goals before you even create a single piece of content.
Laying the Groundwork for Accurate ROI Tracking

Before you can calculate anything, you have to know what success actually looks like for your business. Effective ROI measurement begins by tying your content goals directly to your company's high-level business objectives. If you skip this step, you’re just tracking numbers in a vacuum.
This alignment is what makes your data meaningful. For example, if your company’s main goal is to boost recurring revenue, your content goal shouldn't just be "get more traffic." It needs to be something concrete, like "generate 200 qualified leads for our premium subscription tier this quarter."
Connecting Content to Business Outcomes
You need to think beyond generic metrics. A B2B SaaS company might publish a highly technical whitepaper with the specific goal of getting demo requests. For them, a vital KPI would be the "cost per qualified lead." But a direct-to-consumer brand selling sneakers would have a completely different focus. Their blog post reviewing a new shoe model is all about driving immediate sales, so "revenue per article" becomes their North Star metric.
The whole point is to build a framework where your content is clearly and undeniably linked to the company's bottom line. I’ve found it helpful to look at how other channels approach this; for instance, understanding how to track ROI for your Adwords campaigns can teach you a lot about the discipline of precise goal-setting.
This isn't just a "nice to have" anymore. As of 2025, a staggering 83% of marketing leaders say that demonstrating ROI is their absolute top priority. What's more, 64% of companies are now tying future marketing budgets directly to past ROI performance. If you can't prove your worth, you won't get the resources.
The core mistake I see marketers make is treating content as an isolated activity. To prove its value, you have to frame every goal and KPI in the language of business results—revenue, customer retention, and cost reduction.
To help with this, I often use a simple table to map everything out. It’s a great way to force clarity and ensure everyone on the team is on the same page.
Connecting Business Objectives to Content Goals
| Business Objective | Corresponding Content Goal | Primary KPI |
|---|---|---|
| Increase Customer Retention | Improve customer onboarding and education | Reduction in support tickets; Increase in product feature adoption rate |
| Boost Brand Authority | Become a recognized thought leader in the industry | Increase in organic keyword rankings for top-of-funnel terms; Backlinks from reputable sites |
| Drive New Revenue | Generate high-quality leads for the sales team | Number of Marketing Qualified Leads (MQLs); Lead-to-customer conversion rate |
| Lower Customer Acquisition Cost | Improve organic traffic to reduce paid ad spend | Increase in non-branded organic traffic; Cost per acquisition (CPA) from organic channels |
This simple exercise ensures every piece of content you create has a clear, measurable purpose that directly supports a larger business need.
From Vanity Metrics to Actionable KPIs
It's so easy to get distracted by vanity metrics—things like social media likes or total pageviews. They feel good, but they rarely tell you anything about the financial impact. Actionable KPIs, on the other hand, give you direct insight into what's actually moving the needle.
Here’s a practical way to think about the difference:
- Vanity Metric: Our new blog post got 10,000 pageviews. (So what?)
- Actionable KPI: That same post generated 50 newsletter sign-ups, and we know our subscribers convert to paying customers at a rate of 5%.
See the difference? This simple shift in perspective transforms your content from a line item on a budget sheet into a predictable growth engine. By setting this solid foundation from the start, you're setting yourself up for a clear, defensible ROI calculation that proves the true value of your work.
Picking KPIs That Actually Mean Something for Your Business

Once you’ve aligned your content with your big-picture business goals, it’s time to choose the right key performance indicators (KPIs). This is where a lot of marketers go wrong.
It's easy to get sidetracked by "vanity metrics" like social media likes. They feel good, sure, but they tell you next to nothing about whether your content is actually making money. Chasing them is a fast track to a wasted budget.
To truly measure your content marketing ROI, you need to pick KPIs that draw a straight line between your content and your bottom line. The goal is to shift your thinking from, "How many people saw this?" to "What valuable action did someone take because they saw this?"
Match Your Metrics to the Customer Journey
A great way to approach this is to map your KPIs to different stages of the customer journey. You wouldn't expect a top-of-funnel blog post to close a deal, right? So you shouldn't measure it that way. This ensures you're measuring the right things at the right time.
Here’s a practical way to break down your metrics into four key areas:
- Consumption Metrics: Are people even finding and reading your stuff? Look at unique pageviews, time on page, and scroll depth. These are your first signals of interest.
- Engagement Metrics: This is about how your audience interacts with the content. We're talking social media shares, comments, and especially backlinks earned. High engagement is a fantastic sign that your message is hitting home.
- Lead Generation Metrics: Now we're getting closer to the money. These KPIs include form fills for things like whitepaper downloads or newsletter sign-ups. Each one represents a potential customer entering your pipeline.
- Sales Metrics: This is the ultimate proof. The big ones here are conversion rates, sales revenue attributed to content, and the customer lifetime value (CLV) of leads that came from your content.
I’ve seen teams get excited about thousands of likes on a LinkedIn post, only to realize it brought in zero qualified leads. On the flip side, a niche blog post with just a few hundred views might generate five high-value demo requests. That’s the real difference between vanity and value.
Go Deeper Than Just Raw Numbers
The real magic happens when you start connecting these dots. You might notice, for example, that blog posts with an average time on page over three minutes also happen to have the highest newsletter sign-up rates. That’s a golden insight—it tells you exactly what kind of content you need to create more of.
Tracking lead generation is especially critical for putting a real dollar value on your content, particularly in B2B. A single download of an industry report might not seem like much, but if that person eventually becomes a major client, the ROI is massive. If you're new to this whole concept, understanding https://copymasters.co/blog/what-are-leads-in-business is a great place to start.
Build Your Own KPI Dashboard
Every business is different, so your perfect set of KPIs will be unique. A direct-to-consumer brand might be obsessed with add-to-cart clicks coming from a specific blog post. A SaaS company, on the other hand, will likely focus on the number of trial sign-ups generated by a case study.
The point is to build a dashboard that reflects your specific sales cycle and business model.
Here’s a quick look at how two different types of businesses might prioritize their KPIs:
| Metric Category | B2B SaaS Company | E-commerce Brand |
|---|---|---|
| Primary Lead Metric | Demo Request Form Fills | Email List Sign-ups |
| Primary Sales Metric | Lead-to-Customer Conversion Rate | Revenue per Visitor |
| Key Engagement KPI | Webinar Registrations | Product Page Shares |
By thoughtfully selecting and tracking these layered metrics, you can finally move beyond guesswork. You’ll be able to build a clear, data-backed story that shows exactly how your content contributes to revenue, making it a whole lot easier to justify your budget and prove your worth.
Tracking Your Data and Adding Up Your Total Investment
A real, honest ROI calculation comes down to two simple things: knowing what you made and knowing exactly what you spent to make it. While everyone loves to focus on the returns, it's easy to forget about the total cost of your content marketing, which can completely throw off your numbers. Let's get a handle on both sides of this equation.
To actually measure your gains, you need the right tools in your arsenal. The vast majority of businesses lean on analytics platforms to put a number on their returns. In fact, a whopping 64% of businesses use Google Analytics as their go-to, with social media analytics (44%) and dedicated SEO tools (34%) following close behind. These are your bread and butter for tracking revenue from lead conversions and direct income from your organic traffic.
Getting Your Hands on Performance Data
Your first stop should always be your analytics dashboard. Think of it as the command center for seeing how people are actually interacting with your content and what they do next. If your analytics are set up correctly, you’ll have all the raw data you need to draw a straight line from a piece of content to a real conversion.
Here’s a snapshot of a Google Analytics dashboard showing where users are coming from.

This kind of view instantly tells you which channels—like organic search or direct visits—are bringing in your best, most engaged users. Once you set up specific conversion goals, you can see precisely how many people who read a certain blog post went on to buy something or fill out a contact form. For a much deeper look at this process, check out our full guide on how to measure content performance.
Beyond your main web analytics, you need to pull in data from a few other key places:
- Your CRM: This is your goldmine for tracking the full customer story, from the moment they became a lead (say, from a blog post) all the way to a signed contract. It’s essential for calculating bigger-picture metrics like Customer Lifetime Value (CLV).
- SEO Tools: Platforms like Ahrefs or Semrush can actually estimate the dollar value of your organic traffic, giving you a concrete way to quantify the return you’re getting from all that hard work on keyword rankings.
Tallying Up Your Total Content Investment
This is where so many marketers get tripped up. Your real investment is so much more than the last invoice you paid a freelance writer. To get a truly accurate number, you have to account for every single related expense.
The most common mistake I see is people only counting the direct costs, like writer fees. This gives you a wildly inflated ROI that doesn't reflect how much you're truly spending. To get an honest number, you have to include it all.
Let's break your investment down into a few distinct piles.
1. Direct Production Costs
This is the easy stuff—the obvious expenses tied directly to making the content.
- Fees for freelance writers or your content agency
- Graphic design work for custom images, charts, and infographics
- Any video production or editing expenses
- Subscriptions to stock photo or video sites
2. Internal Team Costs (Salaries)
Don't forget the time your own team is putting in. Their salaries are a real cost.
- A percentage of your content manager’s salary dedicated to the project
- The hours your editors and proofreaders spent reviewing drafts
- Time your social media manager spent creating posts and promoting the content
3. Tools and Software
Make a list of every subscription that helps get your content off the ground.
- SEO and keyword research tools
- Project management software like Asana or Trello
- Analytics and reporting platforms
- Your email marketing service
4. Promotional Spend
This is any cash you spent specifically to get more eyeballs on your content.
- Paid social media ads or boosted posts
- PPC campaigns that point to your content assets
- Any fees paid to influencers for promotion
By carefully adding up both your returns and these comprehensive investments, you’re building a solid, defensible foundation for an ROI figure that actually means something.
Applying the Right Formulas to Calculate ROI
You've gathered your costs and tracked your returns, so now it's time for the moment of truth: calculating your return on investment. The math itself isn't complicated. The real art is knowing which formula to use for which business goal and, more importantly, understanding what that final number actually tells you.
The most common formula you'll see is the classic one. It’s the perfect tool for getting a clear, high-level percentage that answers the big question: for every dollar we put in, how much did we get back?
The Classic ROI Formula:(Return - Investment) / Investment * 100%
Let's say a big blog post cost you a total of $1,000 to create, design, and promote. If that post directly brought in $5,000 in product sales, your math looks like this: ($5,000 - $1,000) / $1,000 * 100% = 400%. That's a 400% return on your investment. Simple and powerful.
While the classic formula is a fantastic starting point, it shines brightest for direct-response goals where the path from content to sale is short and obvious. For longer, more complex sales cycles, you'll need to dig a bit deeper.
Calculating ROI for Service-Based Businesses
Things get a little more interesting when an immediate sale isn't the main goal. For most service businesses or B2B companies, content is all about generating qualified leads, not instant checkouts. To measure this, you have to figure out what a lead is actually worth in dollars and cents.
The trick is to work backward from your sales data.
- Find Your Lead-to-Customer Rate: Start by looking at what percentage of your leads eventually become paying customers. If you close 1 deal for every 10 qualified leads you get, your conversion rate is 10%.
- Determine Customer Lifetime Value (CLV): Next, what's the average total revenue a new customer brings your business over their entire relationship with you? For this example, let's say your average CLV is $4,000.
- Calculate Your Average Lead Value: Now, just multiply your CLV by your conversion rate. In our scenario, that’s
$4,000 * 10% = $400. Each new, qualified lead is worth an average of $400 to your business.
With that number in hand, the ROI calculation becomes clear. If you created a whitepaper for $2,500 and it generated 20 qualified leads, the total return is 20 leads * $400/lead = $8,000.
Your ROI is then ($8,000 - $2,500) / $2,500 * 100% = 220%. Suddenly, an abstract metric like "leads" has a solid financial value tied to it.
This visual helps map out the journey from the initial investment to the long-term value that underpins these calculations.
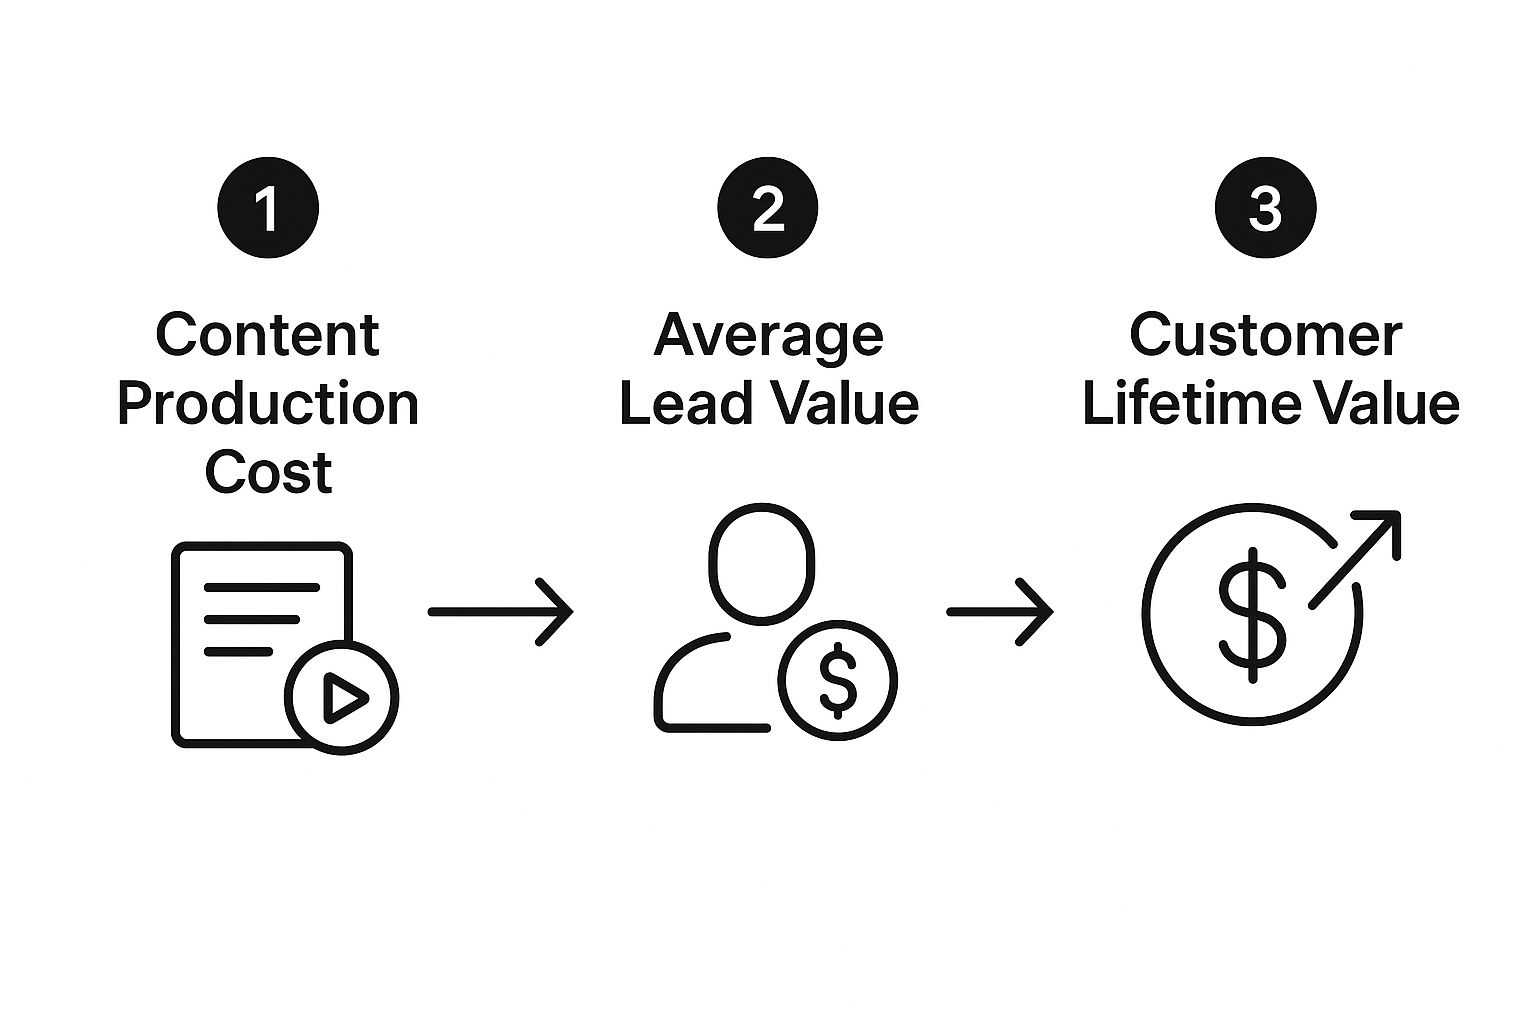
This process really highlights how a single piece of content can have an impact that stretches far beyond that initial lead, connecting directly to a customer's total financial contribution over time.
Choosing the Right Attribution Model
Before you can confidently assign a "Return" value, you need to decide how you're giving credit for a conversion. This is where attribution models come in—they are the rules that determine which touchpoint gets the prize. Your choice here can dramatically change your ROI figures.
A customer might read a blog post, see a social media ad a week later, and then finally click an email link to make a purchase. Which piece of content gets the credit? The answer depends on your model.
| Attribution Model | How It Works | Best For |
|---|---|---|
| First-Touch | The very first interaction a customer has with your brand gets 100% of the credit. | Businesses focused on top-of-funnel awareness and lead generation. |
| Last-Touch | The very last interaction before a conversion gets 100% of the credit. | Companies with short sales cycles and a focus on driving immediate action. |
| Linear | Credit is split evenly across every touchpoint in the customer's journey. | Marketers who want a balanced view of every channel's contribution over a longer sales cycle. |
| Time-Decay | Touchpoints closer to the conversion get more credit than earlier ones. | B2B marketing or campaigns with a distinct consideration phase before purchase. |
Picking the right model is all about matching it to your typical customer journey and your primary business goals. There's no single "best" answer, only the one that gives you the most accurate picture of what's really driving results for your company.
By plugging your own numbers into these formulas, you can produce a defensible ROI figure that speaks the language of business leaders. For more on this, check out this excellent resource on using a DXP ROI Calculator Measuring Digital Investment Impact. Whether you're calculating direct sales or putting a value on leads, this process transforms your content efforts from a line item expense into a proven revenue driver.
Proving Social Media's Impact on the Bottom Line
Let's be honest, tying social media content back to actual revenue can feel like a real marketing puzzle. For years, channels like Instagram and LinkedIn were written off as just top-of-funnel channels, making it incredibly difficult to draw a straight line from a 'like' to a sale. But that's an outdated way of thinking. You absolutely can prove social media's financial contribution if you know where to look.
The trick is to stop obsessing over surface-level engagement and start tracking the real journey a person takes from a social post to your website. This is where UTM parameters become your secret weapon. By adding these simple tags to every link you share, your analytics platform can tell you exactly which posts and campaigns are driving traffic.
From Social Clicks to Sales
Once that traffic hits your site, you can watch what those users do, just like you would with traffic from any other source. Did the people who clicked through from that TikTok video sign up for your newsletter? Did the executives who read your LinkedIn article go on to download a whitepaper? These are the breadcrumbs that connect your social activity to tangible leads.
It's also crucial to look at the bigger picture with assisted conversions. Someone might first discover your brand through an Instagram Reel, search for you on Google a week later, and finally make a purchase after clicking a link in your newsletter. A simplistic "last-click" model would give all the credit to email and none to social. But a multi-touch attribution view correctly shows that Instagram kicked off the entire customer relationship, which is a foundational concept for any solid demand generation strategy.
This isn't just a niche concern—it's a massive priority across the industry. Recent 2025 data reveals that 65% of marketing leaders are pushing for direct connections between their social campaigns and core business objectives. Despite this, only a meager 30% of marketers actually feel confident they can measure social media ROI accurately. That's a huge gap. You can dig deeper into these numbers with Sprout Social's research on social media ROI.
The Rise of Social Commerce
Thankfully, the platforms themselves are making our jobs easier with the explosion of social commerce. Integrated features like Instagram Shops and TikTok Shop are closing the gap between discovery and purchase. This creates a much shorter, more direct path to checkout, allowing for clean revenue attribution and turning your social feeds into powerful sales channels.
Don't just measure what's easy—measure what matters. Your focus should be on how social media influences the entire customer journey, from that first spark of awareness to the final sale and even long-term retention. This is how you build a rock-solid business case for your social media investment.
When you bring it all together—meticulous UTM tracking, a smart attribution model, and the smart use of native commerce features—you can finally change the conversation. You'll move from talking about likes and shares to talking about leads and revenue. That’s how social media sheds its reputation as a cost center and proves its value as a genuine engine for growth.
Got Questions About Content ROI? Let's Unpack Them.
Even with the best formulas and tools at your disposal, measuring content marketing ROI can feel a bit murky. It's a nuanced process, and a few common hang-ups tend to trip up even seasoned pros. Let's tackle some of the most frequent questions I hear from marketers in the trenches.
How Often Should I Actually Calculate My Content ROI?
This is a big one, and the honest answer is: it completely depends on your sales cycle. There's no magic one-size-fits-all schedule here.
If you’re running an e-commerce shop, you can see the impact of your content almost immediately. In that case, crunching the numbers monthly makes perfect sense. You can tie sales directly back to a blog post you published last month.
But for a B2B company with a six-month sales cycle? A monthly report would be pretty useless, maybe even discouraging. You need to give your content time to work its magic. For longer sales cycles, a quarterly ROI analysis will give you a much more realistic and accurate picture of your content’s true influence.
That doesn't mean you should stick your head in the sand for three months. Keep a close eye on your leading indicators—things like organic traffic, keyword ranking movements, and new leads—on a weekly or bi-weekly basis. This lets you spot trends and make quick adjustments without waiting an entire quarter to realize something's off course.
So, What's a "Good" Content Marketing ROI Anyway?
Everyone wants a magic number, but it really varies by industry, your profit margins, and your specific business model. If you're looking for a general benchmark, though, many marketers aim for a 5:1 ratio. That means earning $5 in revenue for every $1 you put into your content. Anything north of that is usually considered a solid win.
But here’s the real secret: the most important benchmark isn't some arbitrary industry standard. It's your own baseline. The real sign of a successful content strategy is a positive ROI that consistently grows quarter after quarter.
Your goal should always be to beat your last performance. That's how you build a powerful, predictable growth channel.
How Can I Possibly Measure the ROI of Top-of-Funnel Content?
This is the classic attribution puzzle. How do you tie revenue to a non-gated blog post that someone read three months before they became a customer? It might seem impossible, but you can absolutely do it with the right setup.
The key is to track how many people who read that initial piece of content eventually convert down the road. This is where your analytics platform becomes your best friend.
In Google Analytics, for example, you need to dig into assisted conversions and explore the Top Conversion Paths report. This report is a goldmine. It will literally show you how many times a blog post served as the first touchpoint in a customer journey that ultimately led to a sale. You can also measure its value through proxy metrics like a jump in organic traffic, better rankings for high-value keywords, or leads coming from a call-to-action embedded within the post.
What if My Content ROI Is Negative?
First off, don't panic. A negative ROI isn’t a failure; it’s data. And valuable data at that. It’s simply a signal telling you that one part of your content engine needs a tune-up.
This is your cue to start investigating. Break down the components to find the weak link:
- Are your content creation costs just too high for the revenue you’re bringing in?
- Is the content failing to attract the right audience, or is your promotion strategy missing the mark?
- Could it be a technical issue? Maybe your conversion tracking is broken, and you’re not even capturing the full picture.
Use that negative number as a catalyst. It's an opportunity to dive in and refine your topics, rethink your distribution, or optimize the conversion paths on your site.
At Copy Masters, we build content strategies designed for measurable returns. Our search-optimized articles are crafted to attract the right audience and guide them toward conversion, turning your blog into a predictable growth engine. Learn how we can help you prove your content's value.
- SaaS SEO Consulting for Predictable Growth - October 20, 2025
- What Is SEO Management Your Guide to Real Results - October 19, 2025
- A Guide to Quality Content for SEO That Ranks - October 18, 2025