
If you can’t measure your marketing, you can’t improve it. It's that simple. Measuring marketing effectiveness is all about drawing a straight line from your activities—the campaigns you run, the content you create—to real business results. This means setting clear, measurable goals from the start, keeping an eye on the right Key Performance Indicators (KPIs), and then using that data to prove your worth and get smarter with your strategy.
Defining What Success Actually Looks Like
Before you even think about tracking a single metric, you have to know what you're aiming for. Too many marketing teams fall into the trap of chasing vanity metrics. You know the ones: social media likes, page views, impressions. They look good on a report and feel nice to share, but they don't really tell you if you're helping the business grow.
Real measurement starts by turning broad business objectives into concrete marketing goals. This gives every metric you track a reason to exist. It’s the difference between saying, "We want more brand awareness," and committing to, "We need to increase organic searches for our brand name by 20% this quarter." One is a wish; the other is a target you can actually hit.
From Business Goals to Marketing Objectives
The trick is to start at the top and work your way down. What does the company need to achieve this year? Is the big-picture goal to boost annual recurring revenue (ARR), break into a new market, or maybe stop so many customers from leaving? Whatever it is, your marketing objectives have to feed directly into that.
Here’s how that looks in practice:
Business Goal: Increase overall company revenue by 15% this year.
Marketing Objective: Generate 500 sales-qualified leads (SQLs) from our content marketing in the next six months.
Business Goal: Improve customer retention and reduce churn by 10%.
Marketing Objective: Get a 25% engagement rate on our customer newsletter and drive 50 upsells from existing clients through targeted email campaigns.
This kind of alignment is what separates a cost center from a revenue driver. It shows everyone, from the CEO down, how your daily work contributes to the company's financial health. Plus, a well-defined goal gives you the clarity you need to pick the right KPIs later.
Key Takeaway: Vague goals lead to vague results. If you can't connect your marketing objective directly to a core business goal, you need a better objective. Success isn't about being busy; it's about making an impact.
The Power of Specificity in Goal Setting
Let's get practical. Imagine a B2B SaaS company that wants to "generate more leads." That’s a start, but it’s not nearly sharp enough to build a strategy around or measure properly.
A much stronger objective would sound something like this: "Generate 200 marketing-qualified leads (MQLs) from organic search in Q3 with a target Cost Per Lead (CPL) under $50."
Now that's a goal you can work with. It's powerful because it is:
- Specific: It calls out the exact number of leads (200) and the channel (organic search).
- Measurable: You can easily track your progress week by week.
- Actionable: The team knows exactly where to focus: SEO and content.
- Relevant: It links directly to the sales pipeline and keeps spending in check (CPL under $50).
- Time-bound: It has a hard deadline (Q3).
This level of detail changes everything. It dictates your keyword strategy, the topics you write about, and how you allocate your budget. For example, building a solid demand generation strategy is nearly impossible without these kinds of clear targets from day one. When you lay this foundation, you’re not just tracking numbers; you’re telling a story of real business growth.
Choosing Metrics That Truly Matter

Once your goals are locked in, the real work begins: picking the right Key Performance Indicators (KPIs) to track your progress. This is a common stumbling block. It's incredibly easy to get overwhelmed by a flood of data and end up chasing metrics that don't actually move the needle for the business.
The secret is to tune out the noise from so-called "vanity metrics" and focus squarely on actionable data.
Think about it this way: vanity metrics, like social media likes or total impressions, give you a short-term ego boost but rarely inform smart business decisions. Actionable metrics, on the other hand, are directly tied to your goals. Your Cost Per Acquisition (CPA) tells you if your ad spend is sustainable, while your Customer Lifetime Value (CLV) dictates your entire retention strategy. You don't need to track everything; you just need to build a dashboard that tells a clear, honest story about what's working.
Aligning KPIs With Your Funnel
Not all metrics are created equal, and their value changes depending on where a customer is in their journey. A classic mistake is trying to measure top-of-funnel awareness activities with bottom-of-funnel conversion KPIs. It just doesn't work.
A much smarter approach is to map your metrics to each stage of the marketing funnel.
Here’s a practical breakdown:
- Top of Funnel (Awareness): You’re casting a wide net to attract a new audience. The metrics here should reflect reach and early engagement. Keep a close eye on organic traffic, keyword rankings, and the ratio of new vs. returning visitors.
- Middle of Funnel (Consideration): At this point, you're nurturing interest and building trust. The focus shifts to metrics like newsletter subscribers, lead magnet downloads, and time on page.
- Bottom of Funnel (Conversion): This is where the magic happens. You should be obsessing over conversion rate, cost per acquisition (CPA), and demo requests.
When you structure your measurement this way, you create a logical narrative. You can clearly see how your awareness efforts are fueling lead generation, and how those leads are ultimately impacting sales.
Different Goals Demand Different Metrics
The KPIs you track are deeply personal to your business model and campaign objectives. A B2B software company and an e-commerce clothing brand might share the overarching goal of growing revenue, but the metrics they monitor to achieve it will be worlds apart.
For instance, an e-commerce store would be laser-focused on:
- Cart Abandonment Rate: High numbers here scream that something is wrong with your checkout process.
- Average Order Value (AOV): Finding ways to increase this is one of the fastest paths to more revenue.
- Customer Lifetime Value (CLV): This number justifies your ad spend and shapes your entire customer retention strategy.
On the other hand, a B2B SaaS company that needs to feed its sales team a steady stream of leads would prioritize:
- Cost Per Lead (CPL): This is essential for keeping acquisition costs from spiraling out of control.
- MQL to SQL Conversion Rate: A critical health metric that tells you if marketing is sending high-quality leads.
- Lead Velocity Rate (LVR): This tracks your month-over-month growth in qualified leads, acting as a great predictor of future revenue.
A key part of a strong measurement strategy is understanding the financial return of your efforts. For a detailed guide, you can learn how to measure marketing ROI effectively.
The following table breaks down how different objectives connect to specific KPIs, giving you a starting point for building your own measurement framework.
Key KPIs by Marketing Objective
| Marketing Objective | Primary KPIs | Secondary KPIs | Example |
|---|---|---|---|
| Increase Brand Awareness | Organic Traffic, Social Media Reach, Keyword Rankings | Impressions, New Visitors, Backlinks | A new tech startup aims to increase its organic traffic by 25% in Q1. |
| Generate Leads | Cost Per Lead (CPL), MQL to SQL Rate, Form Submissions | Conversion Rate, Time on Page, Bounce Rate | A B2B firm wants to lower its CPL to under $50 while increasing lead quality. |
| Boost Sales/Revenue | Return on Ad Spend (ROAS), Average Order Value (AOV) | Cart Abandonment Rate, Customer Lifetime Value | An e-commerce brand targets a 15% increase in AOV through upselling. |
| Improve Customer Loyalty | Customer Lifetime Value (CLV), Churn Rate | Repeat Purchase Rate, Net Promoter Score (NPS) | A subscription service works to reduce its monthly churn rate by 2%. |
This table should help you avoid the trap of tracking generic metrics and instead focus on what truly indicates success for your specific goals.
The bottom line is this: Your metrics must reflect what success actually looks like for your business, not what some generic marketing playbook tells you to track.
Connecting your marketing activities to tangible financial results is absolutely essential. To get a better handle on this, check out our guide on how to calculate your https://copymasters.co/blog/content-marketing-return-on-investment. This will help you close the loop and prove the real value of your work.
Selecting the Right Measurement Models
Knowing your key metrics is one thing, but figuring out why those numbers are moving is where the real work begins. This is exactly what measurement models are for. They act as the framework that connects your marketing efforts to actual business results, helping you finally answer the million-dollar question: which of my activities are actually driving sales?
The right model takes you beyond just counting clicks and conversions. It helps you uncover the story behind the data. By picking a model that fits your business, you can assign credit where it's due and make much smarter calls on where to put your time and budget.
Understanding Attribution Models
Attribution modeling is all about assigning value to the different touchpoints a customer hits on their way to making a purchase. Think of it as mapping out a customer's journey and figuring out which stops were the most important. A customer's path is rarely a straight line; someone might see a social media ad, read a blog post a week later, and finally click on a Google ad to buy something.
Different models slice up the credit in different ways:
- Last-Touch Attribution: This one’s the simplest. It gives 100% of the credit to the very last thing a customer did before converting. It’s easy to track, but it almost always over-emphasizes bottom-of-the-funnel channels and completely ignores all the hard work that built awareness in the first place.
- First-Touch Attribution: As you can guess, this is the exact opposite. It gives all the credit to the very first interaction. It’s great for seeing which channels are bringing new people into your world, but it tells you nothing about what convinced them to actually buy.
- Linear Attribution: This model spreads the credit out evenly across every single touchpoint. While it gives you a more balanced view, it can be misleading by giving a quick glance at a social post the same weight as an in-depth product demo.
- Data-Driven Attribution: This is the most sophisticated approach. It uses machine learning to analyze all the different customer paths—both converting and non-converting—to figure out which touchpoints truly have the most impact. It’s the most accurate, but it requires a ton of data and can sometimes feel like a "black box," making it tough to explain the why behind its conclusions.
So which one should you choose? It really depends on your business goals. If you’re all-in on demand generation, a First-Touch model can be really telling. If you have a super short, direct sales cycle, Last-Touch might be all you need. For most businesses, though, a multi-touch model like Linear or Data-Driven is going to give you a much more complete picture.
Your choice of attribution model directly shapes your perception of channel performance. A Last-Touch model might tell you SEO is your hero, while a First-Touch model might point to paid social. The truth usually lies somewhere in between.
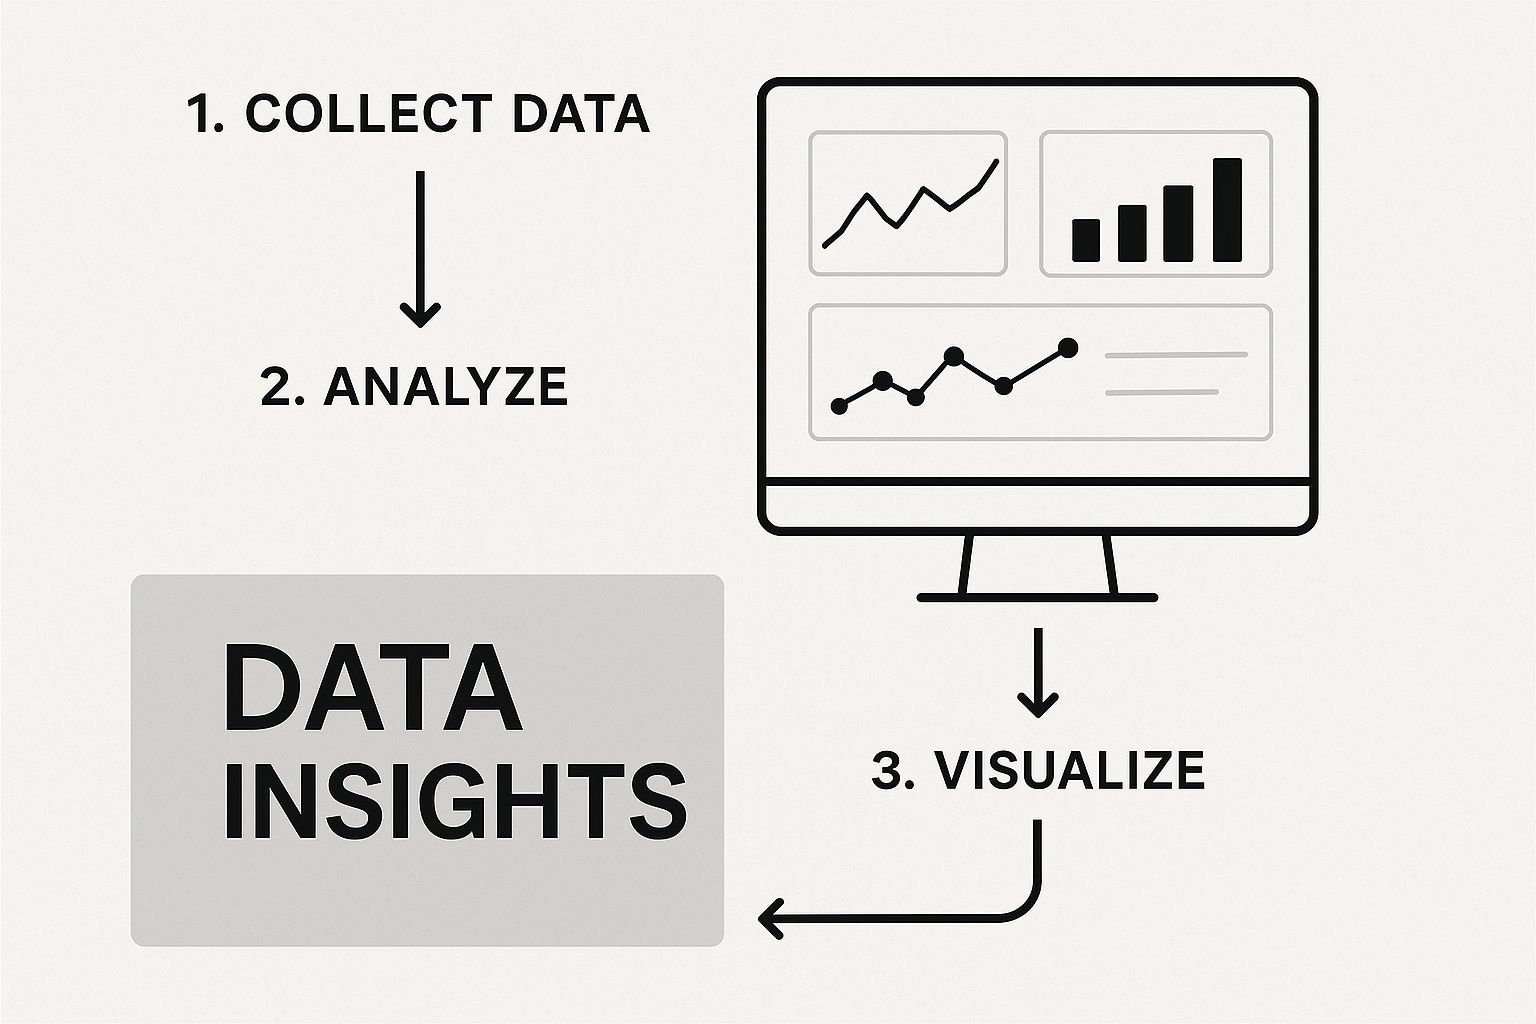
This dashboard gives you a glimpse of how different data points can come together to create a clearer picture for measurement.
Ultimately, the goal is to turn all that raw performance data into a clear story that helps you make strategic moves.
The Comeback of Marketing Mix Modeling
While attribution models zoom in on individual user journeys, Marketing Mix Modeling (MMM) takes a much broader, top-down view. Forget tracking individual clicks. MMM uses statistical analysis on big-picture historical data—like sales figures and total channel spend over several years—to measure the impact of your marketing.
What's great about MMM is that it can analyze both online and offline channels (like TV, radio, and print ads). It even accounts for outside factors like seasonality, economic shifts, and what your competitors are doing. This gives you a genuinely holistic view of what's driving sales.
The resurgence of MMM isn't a coincidence; it’s been turbocharged by new privacy rules, like Apple’s App Tracking Transparency that rolled out in 2021. As tracking individual users got harder, marketers started shifting back to MMM. Modern approaches often blend MMM with controlled ad experiments to validate the insights, a hybrid method some predict will be the 'new gold standard' by 2025 in markets with strict privacy laws. You can read more about these trends in marketing measurement.
This privacy-friendly approach is the key to its comeback. In a world with fewer cookies and less user-level tracking, MMM’s ability to work with anonymized, high-level data makes it an indispensable tool for understanding your overall marketing impact and planning future budgets with confidence.
Building Your Data Collection and Analysis Engine
Guesswork has no place in effective marketing. What you need is clean, accessible data that tells a story. To get there, you have to build a reliable system for gathering and analyzing your marketing performance. This isn't just about grabbing a few tools off the shelf; it's about connecting them to create a single, clear picture of what's actually working.
Think of this system as the foundation for every insight you'll ever gain. It all starts with choosing the right tools that capture critical moments across the entire customer journey, from that first website visit all the way to the final sale and beyond.
Assembling Your Core Toolkit
Your measurement toolkit should be a set of interconnected systems, each with a specific job. You don't need dozens of platforms—in fact, that usually just complicates things. A few essential ones working together seamlessly is the goal. A scattered approach creates data silos, which are the number one enemy of effective marketing measurement.
For most businesses, these are the non-negotiable components:
- Website Analytics: This is your command center. A tool like Google Analytics is non-negotiable for tracking traffic sources, on-site engagement, conversion paths, and audience demographics. It tells you exactly how people interact with your digital storefront.
- Customer Relationship Management (CRM): Your CRM, whether it's Salesforce or HubSpot, is where your customer data lives. It tracks the entire journey from a lead to a loyal customer, giving you invaluable data on conversion rates, sales cycle length, and customer lifetime value.
- Platform-Specific Analytics: Every channel you use—from Google Ads to Meta—has its own powerful analytics dashboard. These are crucial for understanding the nitty-gritty of campaign performance, like ad creative effectiveness, click-through rates, and cost per result.
To truly get the most out of this setup, you'll eventually want to integrate advanced analytics tools that can process and interpret all this marketing data in one place.
Maintaining Data Integrity
Just collecting data isn't enough. If your data is messy, incomplete, or just plain wrong, any insights you pull from it will be flawed. Keeping your data clean is a continuous process, not a one-time setup.
A great place to start is by standardizing your tracking protocols. Use a consistent naming convention for your campaigns across every single platform. For example, a simple structure like Channel_CampaignName_Date makes it infinitely easier to segment and compare performance down the road.
Your marketing insights are only as good as the data they're built on. A little bit of upfront effort in keeping your data clean will save you from making major strategic mistakes down the road.
This kind of discipline prevents the chaos that comes from having ten slightly different campaign names for the same initiative. It ensures you can accurately attribute results and build reports that actually make sense. To see this in action, it's worth learning about the best practices for creating a comprehensive SEO reporting framework.
Turning Raw Data Into a Clear Narrative
Once your data is flowing cleanly, the real work begins. This is where you move from just looking at numbers to understanding the story they tell. The goal here is to slice and dice your data to uncover hidden patterns and opportunities.
Let’s imagine you ran a multi-channel campaign to promote a new e-book. Instead of just looking at the total number of downloads, you need to break the data down:
- Segment by Channel: How did organic search traffic convert compared to your paid social ads? This immediately tells you which channels are most efficient for this type of content.
- Segment by Device: Did mobile users download the e-book at the same rate as desktop users? If you see a big drop-off on mobile, you might have a user experience problem on your landing page.
- Segment by Audience: If you targeted multiple demographics, which one showed the most interest? That's a direct insight you can use to inform the targeting for your very next campaign.
This kind of segmentation transforms a simple metric like "downloads" into a rich story about channel efficiency, user behavior, and audience preferences. It’s how you answer not just "what happened?" but "why did it happen?" and, most importantly, "what should we do next?"
Turning Insights into Action and Optimization

Let's be honest: analysis without action is just an academic exercise. The real magic happens when you use your findings to make smarter, faster decisions. This is where raw data stops being a spreadsheet and starts becoming a competitive advantage, fueling a cycle of constant improvement.
But your insights are only as good as your ability to communicate them. A spreadsheet full of numbers won’t get anyone excited, but a well-designed dashboard that tells a clear story? That gets things done. It’s about moving beyond just reporting what happened and showing the direct line between marketing efforts and business results.
Crafting Dashboards That Drive Decisions
The best dashboards are never one-size-fits-all. Your CEO and your social media manager care about very different things, so your reporting should reflect that. The goal is clarity, not complexity.
Think about creating custom views for different teams:
- For the C-Suite: They need the 30,000-foot view. Focus on high-level business impact with metrics like Marketing ROI, Customer Acquisition Cost (CAC), and Customer Lifetime Value (CLV). The conversation should be about revenue and growth, not clicks and impressions.
- For the Marketing Team: This is where you can get into the weeds. A team-facing dashboard is a tactical tool for daily optimization. It should track campaign-specific KPIs, channel performance, and conversion rates to show what’s working right now.
Imagine a marketing manager glances at their dashboard and sees a new ad creative has a Cost Per Lead (CPL) that's 50% lower than the campaign average. That’s an immediate, actionable insight. They can instantly shift more budget toward that winner.
A great dashboard doesn't just display data; it answers critical business questions at a glance. It should immediately tell stakeholders if you're on track to hit your goals and highlight where the biggest opportunities or problems lie.
Choosing the Right Attribution Model
Before you can truly optimize, you need to understand which touchpoints are actually driving conversions. This is where attribution models come in—they are the frameworks that assign credit to the different marketing channels a customer interacts with on their journey.
Picking the right model is crucial because it directly influences where you invest your time and money. There's no single "best" model; the right choice depends on your sales cycle, business goals, and the complexity of your customer journey.
Here's a quick comparison of the most common models to help you decide.
Attribution Model Comparison
| Attribution Model | How It Works | Best For | Potential Drawback |
|---|---|---|---|
| First-Touch | Gives 100% of the credit to the very first channel the customer interacted with. | Businesses focused on top-of-funnel awareness and demand generation. | Ignores the impact of all subsequent touchpoints that nurtured the lead. |
| Last-Touch | Assigns 100% of the credit to the final touchpoint before conversion. | Short sales cycles where the final click is the most important action. | Fails to credit channels that introduced and educated the customer earlier on. |
| Linear | Distributes credit equally across all touchpoints in the customer journey. | Longer sales cycles where every interaction is considered valuable. | Can undervalue the most influential touchpoints by treating them all the same. |
| Time-Decay | Gives more credit to touchpoints that happened closer to the conversion. | B2B marketing or considered purchases where recent interactions are key. | Can devalue important early-stage awareness-building activities. |
| U-Shaped (Position-Based) | Gives 40% credit to the first touch, 40% to the last touch, and the remaining 20% is split among the middle touches. | A balanced approach for businesses that value both the initial contact and the final conversion driver. | The 40/20/40 split is arbitrary and may not reflect your actual customer journey. |
Ultimately, the goal is to choose a model that gives you the most accurate picture of what's really working. Start with a simple one like Last-Touch and, as you gather more data, consider testing a more nuanced multi-touch model to get a fuller view.
Building a Test and Learn Culture
The most successful marketing teams I’ve worked with all have one thing in common: they operate like scientists. They treat campaigns not as final, perfect creations, but as experiments to be tested, measured, and improved. This is the heart of a "test and learn" culture.
Instead of debating opinions in a meeting, you let the data settle the argument. This simple shift removes ego and guesswork from the equation and replaces them with cold, hard evidence. It creates a powerful feedback loop where every campaign—win or lose—provides valuable lessons for the next one.
The easiest way to build this muscle is by making A/B testing a core part of your process.
Implementing a Robust A/B Testing Process
A/B testing (or split testing) is a beautifully simple way to optimize your marketing. You create two versions of a single thing—an email subject line, a landing page headline, an ad creative—and show them to different audience segments to see which one performs better.
A practical A/B testing process looks like this:
- Formulate a Hypothesis: Start with a clear, testable idea based on your data. For example: "Changing our landing page CTA from 'Learn More' to 'Get Your Free Demo' will increase form submissions because it’s more specific and value-driven."
- Isolate One Variable: This is non-negotiable. Only change one element at a time. If you change the headline and the button color, you'll have no idea which change actually made the difference.
- Run the Test: Use a tool like Google Optimize or Optimizely to split your traffic evenly between the original version (the control) and the new one (the variation).
- Analyze the Results: Be patient! Wait until you have enough data to reach statistical significance. A few dozen visitors won't give you a confident answer. Once the test is done, see which version came out on top.
- Implement and Iterate: If the variation was a clear winner, it becomes the new control. Now, it's time to come up with a new hypothesis and test something else. This commitment to small, consistent improvements is how you achieve massive growth over time.
Common Questions About Measuring Marketing
Even with a solid plan in place, you're bound to run into questions once you start digging into the data. That’s completely normal. Juggling all the tools, terminology, and metrics can feel overwhelming, but getting clear on the common sticking points is what separates a confident marketing strategy from just guessing what works.
Let's walk through some of the questions I hear most often from marketers in the trenches.
How Often Should I Check My Marketing Performance?
There’s no magic number here. The right frequency really depends on the marketing channel you're looking at. The key is to match your reporting cadence to the natural pace of that channel.
For instance, some channels demand almost constant attention, while others need time to breathe.
Daily or Weekly: This is non-negotiable for paid advertising like Google Ads or social media campaigns. You've got money on the line, so you need to be checking things like ad spend, click-through rates, and your cost per conversion almost in real-time. This is how you catch problems early and optimize on the fly.
Monthly or Quarterly: This rhythm works perfectly for long-game strategies like SEO and content marketing. These efforts are a slow burn; it takes time for content to rank and for organic traffic to build. A monthly or quarterly check-in gives you enough data to see real trends without getting discouraged by daily fluctuations.
Quarterly or Annually: Big-picture metrics like Customer Lifetime Value (CLV) and overall Marketing ROI don’t need constant monitoring. A quarterly or yearly review is perfect for zooming out and assessing how your marketing efforts are impacting the company's bottom line.
What Are the Best Tools for Measuring Marketing?
I always tell people to stop looking for a single "best" tool. Instead, think about building a smart, connected marketing stack. The real magic happens when you get tools talking to each other, so you can see the full story of your customer's journey.
At a minimum, your toolkit should have these three pillars:
- Google Analytics: This is the bedrock. It's your go-to for understanding how people find and interact with your website.
- A CRM (like HubSpot or Salesforce): This is where you connect marketing actions to actual sales. It's your source of truth for tracking a lead from their very first click all the way to becoming a customer.
- Native Platform Analytics: The data inside Google Ads, Meta Business Suite, and LinkedIn Ads is invaluable. These platforms give you the most detailed, granular insights into how your specific campaigns are performing.
Once you have these, you can tie everything together with a data aggregator like Supermetrics and a visualization tool like Looker Studio. This lets you build a single dashboard, saving you from the headache of hopping between a dozen different platforms.
How Can I Actually Measure the ROI of My Content Marketing?
Measuring content ROI feels a bit fuzzy for a lot of marketers, but it's more straightforward than you think. You just have to connect the right dots.
Start with the direct impact on your SEO. Are you seeing growth in organic traffic? Are your keyword rankings for important terms climbing? That’s your first layer of value.
Next, get serious about using UTM parameters on every link in your content. This is how you trace leads and sales directly back to a specific blog post or guide. When you look at your CRM data, you can start to see how many of your paying customers first engaged with a piece of content. The formula itself is simple: (Revenue from Content – Content Cost) / Content Cost.
Think of it this way: all your KPIs are metrics, but only your most critical, goal-oriented metrics are KPIs. A 'metric' is any data point you can track, like email open rate. A 'Key Performance Indicator' (KPI), however, is a vital metric you've chosen to measure progress toward a core business goal, like 'new trial sign-ups from organic search.'
At Copy Masters, we believe every piece of content should be a measurable asset that drives growth. Our SEO content-writing service delivers articles designed not just to rank, but to convert, turning your blog into a predictable engine for traffic, leads, and sales. See how we can transform your content strategy.
- SaaS SEO Consulting for Predictable Growth - October 20, 2025
- What Is SEO Management Your Guide to Real Results - October 19, 2025
- A Guide to Quality Content for SEO That Ranks - October 18, 2025